Rugged bottom structure providing fishing opportunities exists throughout the Chesapeake Bay. It may be charted as shoals, marked by aids to navigation, or inferred by sounding data and depth contour lines on nautical charts – but there are also rugged bottom features which are located where charts suggest flat or gradually sloping bottom. Modern navigation and fish-finding technology and shaded relief bathymetric images facilitate the search for bottom features and potential fishing opportunities. A couple of amazingly useful structure-finding tools available to anglers include the National Oceanic and Atmospheric Administration (NOAA) Bathymetric Data Viewer (BDV) web application, and electronic nautical and bathymetric charts. Few people, however, use the BDV – or for that matter, are even aware of it.
Using the Bathymetric Data Viewer
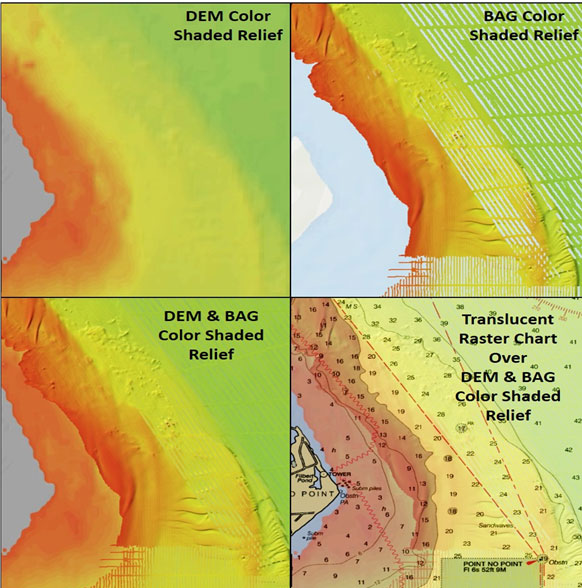
NOAA side-scan sonar coverage is partial in the Chesapeake, but the combination of sonar data and side-scan images shown in shaded relief overlaid on a translucent digital chart are powerful search aids. Where NOAA side-scan sonar image coverage is available, distinct rugged bottom structure can be discerned in otherwise non-descript areas. Some of these anomalies are subtle. Blending into chart colors, the anomalies are essentially hidden in plain sight and can be easily missed without careful, close review. An interesting formation that provides a working example of what to look for is along the western shore south of Cedar Point and just north of Point No Point (seen above).
The graphic above shows the different visual scenes that can be generated as you click the different boxes in the BDV menu. “DEM Color Shaded Relief” displays sounding data. “BAG Color Shaded Relief” displays side-scan sonar images. DEM and BAG images can be combined, and either or both can be overlaid on a raster nautical chart. This is the basic toolbox for searching the BDV for bottom structure. Zooming in on the BAG Color Shaded Relief image on-line reveals even more rugged character than is shown in the graphic. You won’t see any of this detail on a regular chart, but it’s here for interested anglers to discover on the NOAA BDV.
Color-shaded relief for soundings is useful for scoping broad areas. The area around Pooles Island, for example, abounds with structure. Many trenches off Pooles Island, especially to the southeast to down off Tolchester, were created by dredges to extract relic oyster shell for use in oyster restoration. The old dredge cuts provide a form of structure that interacts with physical forces to provide predator foraging opportunity. Click on the “DEM Color Shaded Relief” to fill in depth sounding images. Overlay the image with a translucent navigation chart using the click-on box in the drop-down. Zoom in and look for anomalies under the chart layer between depth lines. Also look along steep drop-offs for anomalies. Then, remove the chart layer to see what’s there. Some interesting features will stand out!
BDV Examples
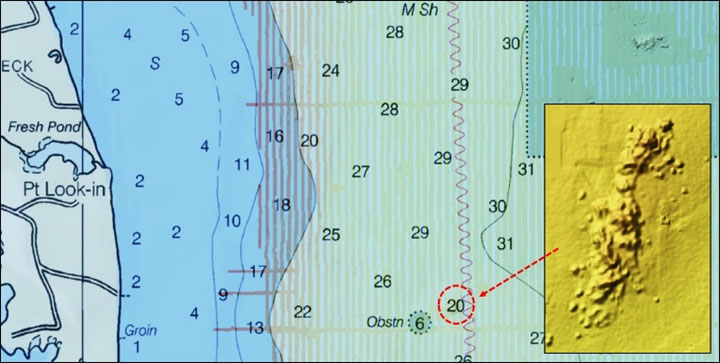
Although many historic reef formations were flattened and smoothed by oyster dredges, there are still some irregular reef formations out there. For example, east of Point Look-In southeast of the Point No Point Fish Haven and adjacent to a marked obstruction, there’s a bottom anomaly. It’s positioned directly under sounding data. Neither NOAA’s Automatic Wreck and Obstruction Information System (AWOIS) nor Electronic Navigation Chart data have any data for the obstruction. While zooming in on the obstruction with the BDV to check what might be there, however, the anomaly caught my attention. It was obscured by the chart data so it wasn’t obvious at first. But at the lowest zoom levels, the chart disappears. It was then that the anomaly revealed itself, and another light tackle jigging spot could be added to the run-and-gun list. Also, this provides a lesson to be learned when using the BDV. There may be anomalies located directly under charted data, so be sure to remove (click off) the chart and look underneath, before moving on.
Below Point Lookout as the Bay widens up the bottom, in general, has a more gradual contour. Thus, bathymetry depth lines are farther apart, and less helpful in pinpointing hard bottom structure. And it’s in this portion of the Bay where NOAA’s BDV really shines. Structure in otherwise unremarkable areas is revealed by using BDV image overlay features. Again, overlay the image with a translucent navigation chart using the click-on box in the drop-down, zoom in and look for anomalies under the chart layer between depth lines, and look along steep drop-offs for anomalies. Then, remove the chart layer to see what’s there.
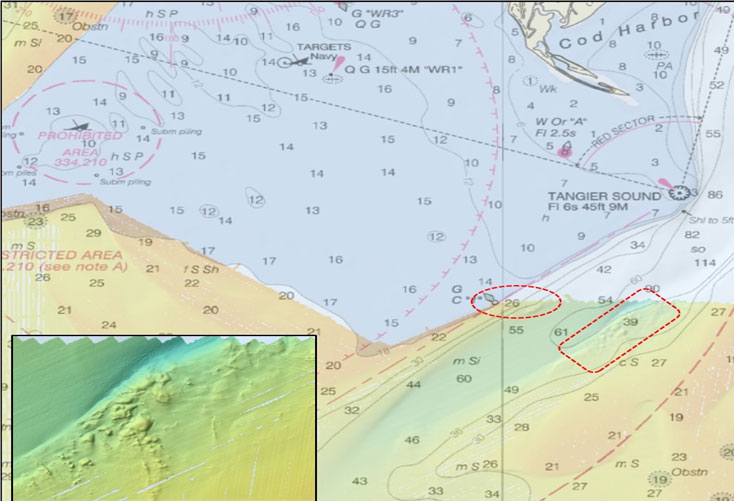
South of Tangier Sound Light provides another excellent example. Two interesting anomalies are clearly visible under the translucent BDV chart. The BAG color shaded relief is under the chart in the graphic. The insert is a screenshot of the larger anomaly with the chart layer removed. The images have not been retouched except for the red circles added to highlight the structure. There is an extremely rugged shelf along the edge of a naturally deep channel. It was this channel that drew my attention while slowly scrolling through the BDV images specifically looking for rough channel edges. The dark blue shaded relief of the deep-water areas provides additional contrast that facilitates seeing anomalies. These natural features provide additional fishing options away from the Tangier targets (shown in the upper left-hand corner of the graphic), and the San Marcos target (not shown).
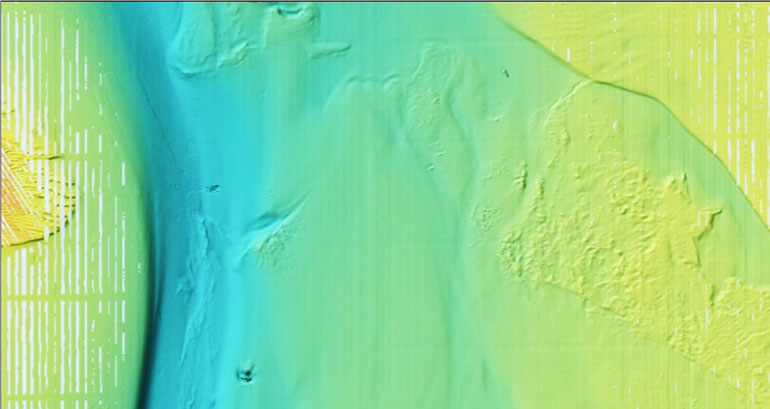
A good location to practice using the BDV is the area east of Smith Point, shown in the final screenshot, a “BAG Color Shaded Relief” image. The broad area shown is within easy striking distance of Southern Maryland and the Northern Neck of Virginia, and is heavily fished. Just to the south is the nested pipe of the Northern Neck Fish Haven which is also within BDV side-scan sonar coverage. Make sure to zoom in on the various bottom features. The closer the zoom, the sharper the image. Look for sub-features within structure such as underwater ravines and bowls that fish may orient to. Also check current data, and consider how current may interact with the structure.
Using this tool, anglers up and down the Bay can locate potential fishing grounds that they might otherwise never find. Fishing grounds that are hidden in plain sight.
Author Wayne Young is the author of “Bridges Under Troubled Waters: Upper Chesapeake and Tidal Potomac Fishing Reefs,” available at Amazon. You can find his Facebook page at Chesapeake Bay Fishing Reefs.
Sign up here to get the weekly FishTalk Chesapeake Bay and Mid-Atlantic fishing reports in your email inbox, every Friday by noon.